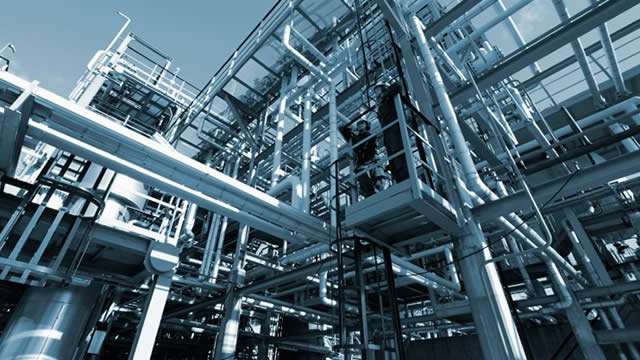
New

Chrome Plugin Live! Redefine the way you read FinTwit 🚀 Install Now

You have successfully sign out
Loading...
Shape
CECO Environmental Corp.
CECO
Shape
US Flag

NASDAQ

1B

Industrial - Pollution & Treatment Controls

Next Earning date - 04 Mar 2025

1B

Industrial - Pollution & Treatment Controls

Next Earning date - 04 Mar 2025

29.60USD
Shape-2.55 ( -7.93%)
favorite-chart

Relative Strenght

85
favorite-chart

Volume Buzz

477%
favorite-chart

Earning Acce

No
favorite-chart

Dist 52w H.

16%

Quote Panel

Shape
Updated January 19, 2025
1W -3.43 % 1M 0.37 % 3M 10.24 % 1Y 53.29 %

Key Metrics

Shape
  • Market Cap

    1.04B


  • Shares Outstanding

    34.98M


  • Share in Float

    29.70M


  • Dividende

    0


  • Earning Date

    04 Mar 2025


  • Price Target

    29.6


  • Average Volume

    302559


  • Beta

    1.349


  • Range

    18.5-35.16


  • Industry

    Industrial - Pollution & Treatment Controls


  • Website

    https://www.cecoenviro.com


  • Sector

    Industrials


Fundamentals

Shape

Relative Strength

Shape

CECO

Sector

loading...

Top 5 RS in Group

Symbol

Company

RS

5-Day Perf.

Forecast

Shape

$696M

Shape414%

2025-Revenue

$1.14

Shape1807%

2025-EPS

$60M

Shape479%

2025-EBITDA

Analyst rating

Strong Sell

Sell

Buy

Neutral

Strong Buy

Shape

Buy

Price Target

0.00(-100.00%)

Number of analyst

0

Last analyst upgrade/downgrade

No Data Available

Earnings GrowthShape

status-upYoY

Current

Estimates

Q4.22

arrow
arrow

+110%

0.21
vs 0.1

Q1.23

arrow
arrow

-29%

0.1
vs 0.14

Q2.23

arrow
arrow

-17%

0.15
vs 0.18

Q3.23

arrow
arrow

+10%

0.22
vs 0.2

Q4.23

arrow
arrow

+33%

0.28
vs 0.21

Q1.24

arrow
arrow

+10%

0.11
vs 0.1

Q2.24

arrow
arrow

+33%

0.2
vs 0.15

Q3.24

arrow
arrow

-36%

0.14
vs 0.22

Q4.24

arrow
arrow

+16%

0.33
vs 0.28

Q1.25

arrow
arrow

-14%

0.1
vs 0.11

Sales GrowthShape

status-upYoY

Current

Estimates

Q4.22

arrow
arrow

+24%

116.4M  vs 93.6M

Q1.23

arrow
arrow

+22%

112.6M  vs 92.4M

Q2.23

arrow
arrow

+23%

129.2M  vs 105.4M

Q3.23

arrow
arrow

+38%

149.4M  vs 108.4M

Q4.23

arrow
arrow

+32%

153.7M  vs 116.4M

Q1.24

arrow
arrow

+12%

126.3M  vs 112.6M

Q2.24

arrow
arrow

+6%

137.5M  vs 129.2M

Q3.24

arrow
arrow

-9%

135.5M  vs 149.4M

Q4.24

arrow
arrow

+16%

177.9M  vs 153.7M

Q1.25

arrow
arrow

+14%

144M  vs 126.3M

Return on EquityShape

status-upQoQ

Q4.22

arrow
arrow

+4%

0.04
vs 0.01

Q1.23

arrow
arrow

+1%

0.01
vs 0.04

Q2.23

arrow
arrow

+2%

0.02
vs 0.01

Q3.23

arrow
arrow

+1%

0.01
vs 0.02

Q4.23

arrow
arrow

+2%

0.02
vs 0.01

Q1.24

arrow
arrow

+1%

0.01
vs 0.02

Q2.24

arrow
arrow

+2%

0.02
vs 0.01

Q3.24

arrow
arrow

+1%

0.01
vs 0.02

Institutionnal OwnershipShape

status-upQoQ

Q3.18

arrow
arrow

155

155
vs 166

-7%

Q4.18

arrow
arrow

162

162
vs 155

5%

Q1.19

arrow
arrow

168

168
vs 162

4%

Q2.19

arrow
arrow

192

192
vs 168

14%

Q3.19

arrow
arrow

222

222
vs 192

16%

Q4.19

arrow
arrow

152

152
vs 222

-32%

Q1.20

arrow
arrow

2

2
vs 152

-99%

Q3.21

arrow
arrow

1

1
vs NA

NA

Earnings Growth

Latest News