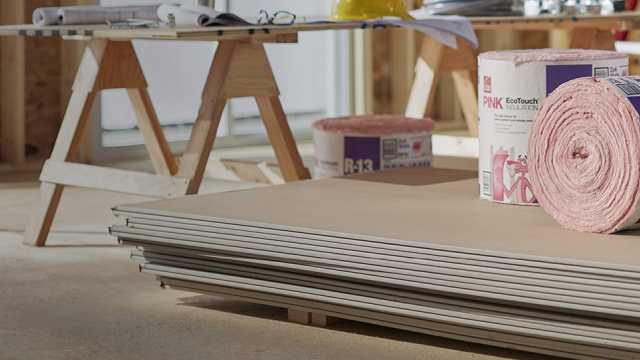
TopBuild Corp., together with its subsidiaries, engages in the installation and distribution of insulation and other building products to the construction industry. The company operates in two segments, Installation and Specialty Distribution. It provides insulation products and accessories, glass and windows, rain gutters, afterpaint products, fireproofing products, garage doors, fireplaces, closet shelving, roofing materials, and other products; and insulation installation services. The company also offers various services and tools to assist builders in applying the principles of building science to new home construction, which include pre-construction plan reviews, diagnostic testing, and various inspection services; and home energy rating services. In addition, it distributes building and mechanical insulation, insulation accessories, and other building product materials for the residential, commercial, and industrial end markets. The company serves single-family homebuilders, single-family custom builders, multi-family builders, commercial general contractors, remodelers, and individual homeowners, as well as insulation contractors, gutter contractors, weatherization contractors, other contractors, dealers, metal building erectors, and modular home builders. It operates approximately 235 installation branches and 175 distribution centers in the United States and Canada. The company was formerly known as Masco SpinCo Corp. and changed its name to TopBuild Corp. in March 2015. TopBuild Corp. was incorporated in 2015 and is headquartered in Daytona Beach, Florida.