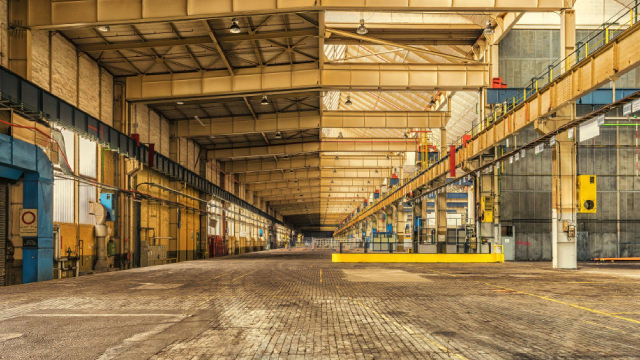
New

Chrome Plugin Live! Redefine the way you read FinTwit 🚀 Install Now

You have successfully sign out
Loading...
Shape
Concrete Pumping Holdings, Inc.
BBCP
Shape
US Flag

NASDAQ

EPS improving

EPS improving

363M

Engineering & Construction

Next Earning date - N/A

7.06USD

Shape0.10 ( 1.44%)
Market Closed (as of Oct 02, 20:00 EDT)
favorite-chart

Relative Strenght

62
favorite-chart

Volume Buzz

17%
favorite-chart

Earning Acce

Yes
favorite-chart

Dist 52w H.

27%

Quote Panel

Shape
Updated October 3, 2025
1W 1.29 % 1M 3.67 % 3M 10.83 % 1Y 40.08 %

Key Metrics

Shape
  • Market Cap

    363.41M


  • Shares Outstanding

    51.47M


  • Share in Float

    21.80M


  • Dividende

    1


  • Earning Date

    No Data


  • Price Target

    7.06


  • Average Volume

    90828


  • Beta

    1.116


  • Range

    4.78-9.678


  • Industry

    Engineering & Construction


  • Website

    https://www.concretepumpingholdings.com


  • Sector

    Industrials


Fundamentals

Shape

Relative Strength

Shape

BBCP

Sector

loading...

Top 5 RS in Group

Symbol

Company

RS

5-Day Perf.

Forecast

Shape

$392M

Shape278%

2026-Revenue

$0.16

Shape149%

2026-EPS

$98M

Shape263%

2026-EBITDA

Analyst rating

Strong Sell

Sell

Buy

Neutral

Strong Buy

Shape

Buy

Price Target

0.00(N/A)

Number of analyst

0

Last analyst upgrade/downgrade

UBS

downgrade

Previous: Not converted

2024-09-06

Now: Neutral

William Blair

downgrade

Previous: Not converted

2024-06-07

Now: Market Perform

Earnings GrowthShape

status-upYoY

Current

Estimates

Q4.23

arrow
arrow

+14%

0.16
vs 0.14

Q1.24

arrow
arrow

N/A

-0.02
vs 0.11

Q2.24

arrow
arrow

-44%

0.05
vs 0.09

Q3.24

arrow
arrow

-28%

0.13
vs 0.18

Q4.24

arrow
arrow

N/A

0.16
vs 0.16

Q1.25

arrow
arrow

N/A

-0.04
vs -0.02

Q2.25

arrow
arrow

N/A

-0.01
vs 0.05

Q3.25

arrow
arrow

-46%

0.07
vs 0.13

Q4.25

arrow
arrow

-44%

0.09
vs 0.16

Q1.26

arrow
arrow

N/A

-0.07
vs -0.04

Sales GrowthShape

status-upYoY

Current

Estimates

Q4.23

arrow
arrow

+5%

120.2M  vs 114.9M

Q1.24

arrow
arrow

+4%

97.7M  vs 93.6M

Q2.24

arrow
arrow

-1%

107.1M  vs 107.8M

Q3.24

arrow
arrow

-9%

109.6M  vs 120.7M

Q4.24

arrow
arrow

-7%

111.5M  vs 120.2M

Q1.25

arrow
arrow

-12%

86.4M  vs 97.7M

Q2.25

arrow
arrow

-12%

94M  vs 107.1M

Q3.25

arrow
arrow

-5%

103.7M  vs 109.6M

Q4.25

arrow
arrow

-7%

103.3M  vs 111.5M

Q1.26

arrow
arrow

-4%

82.8M  vs 86.4M

Return on EquityShape

status-upQoQ

Q2.23

arrow
arrow

+2%

0.02
vs 0.02

Q3.23

arrow
arrow

+3%

0.03
vs 0.02

Q4.23

arrow
arrow

+3%

0.03
vs 0.03

Q1.24

arrow
arrow

-1%

-0.01
vs 0.03

Q2.24

arrow
arrow

+1%

0.01
vs -0.01

Q3.24

arrow
arrow

+2%

0.02
vs 0.01

Q4.24

arrow
arrow

+3%

0.03
vs 0.02

Q1.25

arrow
arrow

-1%

-0.01
vs 0.03

Q2.25

arrow
arrow

0%

-0.00
vs -0.01

Q3.25

arrow
arrow

+1%

0.01
vs -0.00

Institutionnal OwnershipShape

status-upQoQ

Q1.23

arrow
arrow

86

86
vs 88

-2%

Q2.23

arrow
arrow

87

87
vs 86

1%

Q3.23

arrow
arrow

84

84
vs 87

-3%

Q4.23

arrow
arrow

88

88
vs 84

5%

Q1.24

arrow
arrow

93

93
vs 88

6%

Q2.24

arrow
arrow

93

93
vs 93

NA

Q3.24

arrow
arrow

100

100
vs 93

8%

Q4.24

arrow
arrow

104

104
vs 100

4%

Q1.25

arrow
arrow

106

106
vs 104

2%

Q2.25

arrow
arrow

99

99
vs 106

-7%

Earnings Growth

Latest News