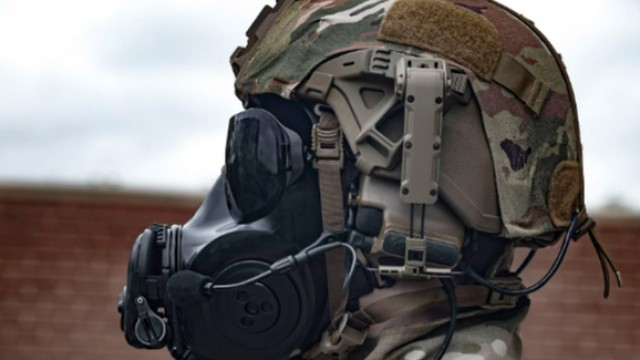
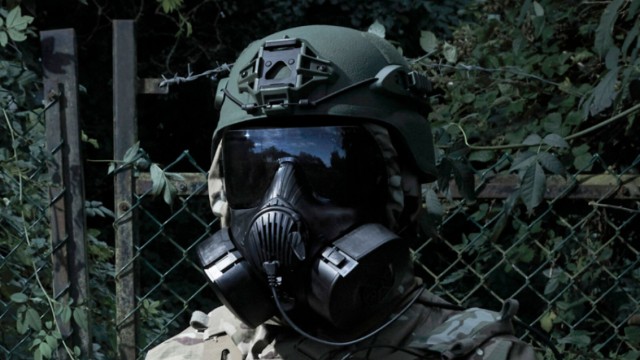
New

Chrome Plugin Live! Redefine the way you read FinTwit 🚀 Install Now

You have successfully sign out
Loading...
Shape
Avon Protection plc
AVNBF
Shape
US Flag

OTC

Unprofitable

EPS improving

Unprofitable

EPS improving

779M

Aerospace & Defense

26.23USD

0.00 ( 0.00%)
Market Open
favorite-chart

Relative Strenght

favorite-chart

Volume Buzz

488%
favorite-chart

Earning Acce

Yes
favorite-chart

Dist 52w H.

0%

Quote Panel

Shape
Updated July 10, 2025
1W 0.00 % 1M 8.39 % 3M 48.86 % 1Y 76.28 %

Key Metrics

Shape
  • Market Cap

    779.14M


  • Shares Outstanding

    29.70M


  • Share in Float

    28.51M


  • Dividende

    0.24


  • Earning Date

    No Data


  • Price Target

    26.231


  • Average Volume

    51


  • Beta

    0.248


  • Range

    14.05-26.231


  • Industry

    Aerospace & Defense


  • Website

    https://www.avon-protection-plc.com


  • Sector

    Industrials


Fundamentals

Shape

N/A

P/E Ratio

2.96x

P/S Ratio

5.23x

P/B Ratio

0.5

Debt/Equity

1.1%

Net Margin

$0.2

EPS

How AVNBF compares to sector?

P/E Ratio

Relative Strength

Shape

AVNBF

Sector

loading...

Top 5 RS in Group

Symbol

Company

RS

5-Day Perf.

Forecast

Shape

Analyst rating

Last analyst upgrade/downgrade

Earnings GrowthShape

status-upYoY

Current

Estimates

Q1.20

arrow
arrow

N/A

NA
vs NA

Q3.20

arrow
arrow

N/A

NA
vs NA

Q1.21

arrow
arrow

N/A

NA
vs NA

Q3.21

arrow
arrow

N/A

-1.23
vs NA

Q1.22

arrow
arrow

N/A

-0.50
vs NA

Q3.22

arrow
arrow

+112%

0.15
vs -1.23

Q1.23

arrow
arrow

N/A

-0.14
vs -0.50

Q3.23

arrow
arrow

N/A

-0.43
vs 0.15

Q1.24

arrow
arrow

N/A

-0.05
vs -0.14

Q3.24

arrow
arrow

+143%

0.19
vs -0.43

Sales GrowthShape

status-upYoY

Current

Estimates

Q1.20

arrow
arrow

NA

94.7M  vs NA

Q3.20

arrow
arrow

-31%

73.3M  vs 105.7M

Q1.21

arrow
arrow

+32%

125M  vs 94.7M

Q3.21

arrow
arrow

+68%

122.9M  vs 73.3M

Q1.22

arrow
arrow

-5%

118.9M  vs 125M

Q3.22

arrow
arrow

+12%

138M  vs 122.9M

Q1.23

arrow
arrow

+1%

120.1M  vs 118.9M

Q3.23

arrow
arrow

-10%

123.6M  vs 138M

Q1.24

arrow
arrow

+7%

127.9M  vs 120.1M

Q3.24

arrow
arrow

+25%

154.4M  vs 123.6M

Return on EquityShape

status-upQoQ

Q1.21

arrow
arrow

+1%

0.01
vs 0.03

Q3.21

arrow
arrow

-10%

-0.10
vs 0.01

Q1.22

arrow
arrow

-4%

-0.04
vs -0.10

Q3.22

arrow
arrow

+7%

0.07
vs -0.04

Q1.23

arrow
arrow

-2%

-0.02
vs 0.07

Q3.23

arrow
arrow

-6%

-0.06
vs -0.02

Q1.24

arrow
arrow

-1%

-0.01
vs -0.06

Q3.24

arrow
arrow

+2%

0.02
vs -0.01

Institutionnal OwnershipShape

status-up

Earnings Growth

Latest News