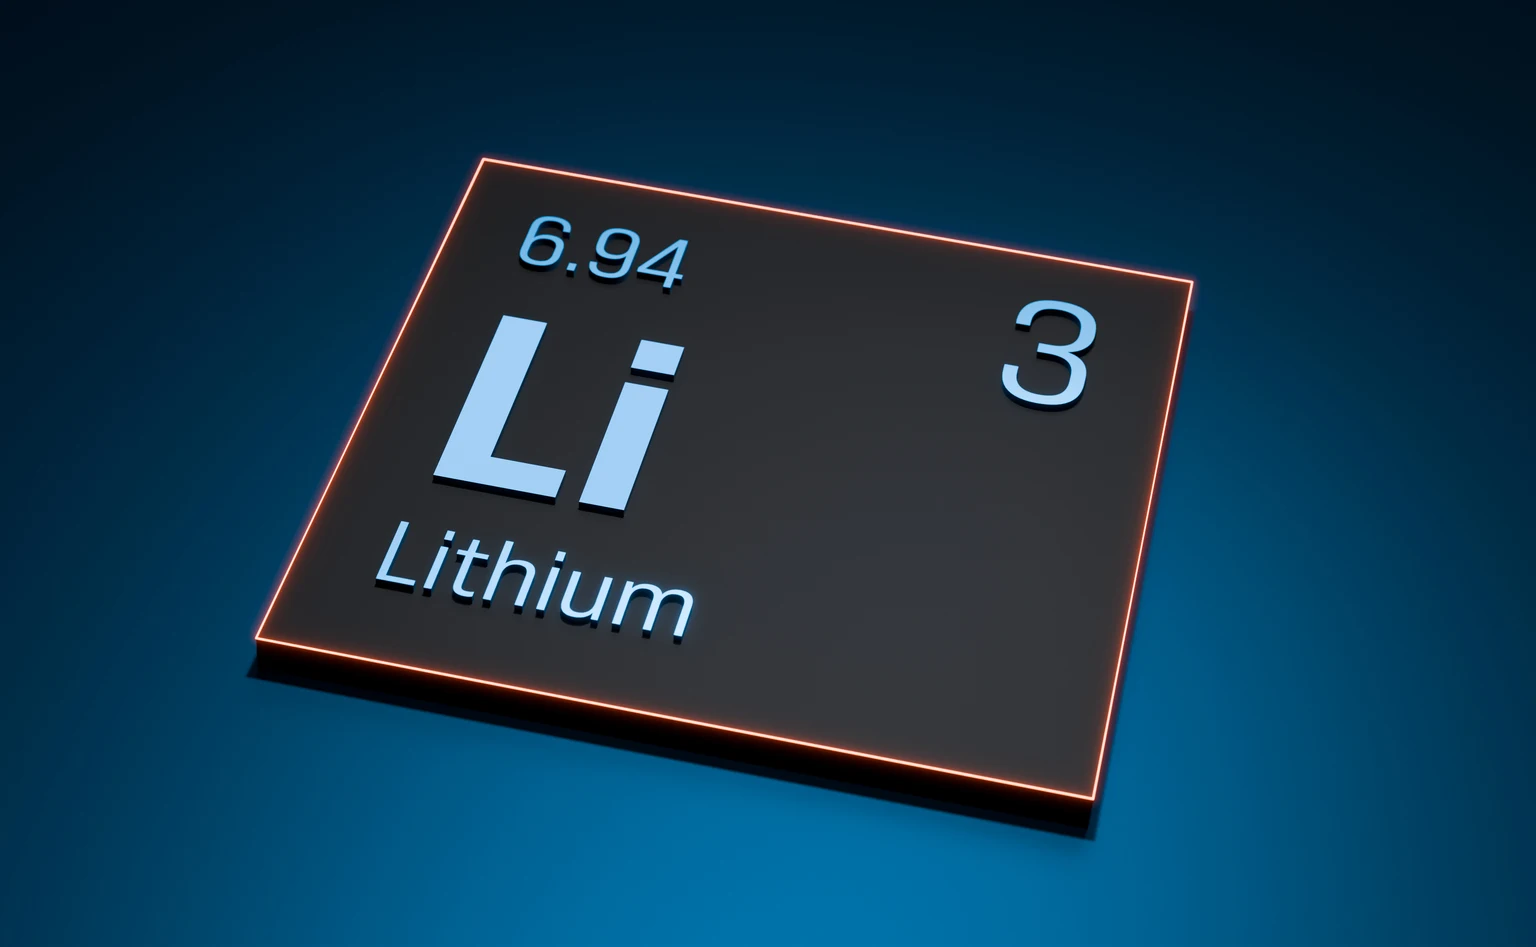
Albemarle Corporation develops, manufactures, and markets engineered specialty chemicals worldwide. It operates through three segments: Lithium, Bromine, and Catalysts. The Lithium segment offers lithium compounds, including lithium carbonate, lithium hydroxide, lithium chloride, and lithium specialties; and reagents, such as butyllithium and lithium aluminum hydride for use in lithium batteries for consumer electronics and electric vehicles, high performance greases, thermoplastic elastomers for car tires, rubber soles, plastic bottles, catalysts for chemical reactions, organic synthesis processes in the areas of steroid chemistry and vitamins, life sciences, pharmaceutical industry, and other markets. It also provides cesium products for the chemical and pharmaceutical industries; zirconium, barium, and titanium products for pyrotechnical applications that include airbag initiators; technical services for the handling and use of reactive lithium products; and lithium-containing by-products recycling services. The Bromine segment offers bromine and bromine-based fire safety solutions; specialty chemicals, including elemental bromine, alkyl and inorganic bromides, brominated powdered activated carbon, and other bromine fine chemicals for use in chemical synthesis, oil and gas well drilling and completion fluids, mercury control, water purification, beef and poultry processing, and other industrial applications; and other specialty chemicals, such as tertiary amines for surfactants, biocides, and disinfectants and sanitizers. The Catalysts segment provides hydroprocessing, isomerization, and akylation catalysts; fluidized catalytic cracking catalysts and additives; and organometallics and curatives. The company serves the energy storage, petroleum refining, consumer electronics, construction, automotive, lubricants, pharmaceuticals, and crop protection markets. Albemarle Corporation was founded in 1887 and is headquartered in Charlotte, North Carolina.