New

Chrome Plugin Live! Redefine the way you read FinTwit 🚀 Install Now

You have successfully sign out
Loading...
Shape
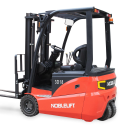
Noblelift Intelligent Equipment Co.,Ltd.
603611.SS
Shape
US Flag

SHH

6B

Agricultural - Machinery

22.75CNY

Shape-0.46 ( -1.98%)
Market Open
favorite-chart

Relative Strenght

favorite-chart

Volume Buzz

-24%
favorite-chart

Earning Acce

No
favorite-chart

Dist 52w H.

5%

Quote Panel

Shape
Updated July 13, 2025
1W 6.46 % 1M 10.81 % 3M 45.00 % 1Y 54.24 %

Key Metrics

Shape
  • Market Cap

    5.86B


  • Shares Outstanding

    257.60M


  • Share in Float

    149.21M


  • Dividende

    6.43221


  • Earning Date

    No Data


  • Price Target

    22.75


  • Average Volume

    9.14M


  • Beta

    0.135


  • Range

    14.36-23.97


  • Industry

    Agricultural - Machinery


  • Website

    https://www.noblelift.com


  • Sector

    Industrials


Fundamentals

Shape

Relative Strength

Shape

603611.SS

Sector

loading...

Top 5 RS in Group

Symbol

Company

RS

5-Day Perf.

Forecast

Shape

$9B

Shape470%

2026-Revenue

$2.78

Shape479%

2026-EPS

$916M

Shape473%

2026-EBITDA

Analyst rating

Strong Sell

Sell

Buy

Neutral

Strong Buy

Shape

Price Target

NaN(-100.00%)

Number of analyst

Last analyst upgrade/downgrade

No Data Available

Earnings GrowthShape

status-upYoY

Current

Estimates

Q4.22

arrow
arrow

+52%

0.44
vs 0.29

Q1.23

arrow
arrow

+45%

0.41
vs 0.28

Q2.23

arrow
arrow

-5%

0.46
vs 0.48

Q3.23

arrow
arrow

+44%

0.53
vs 0.37

Q4.23

arrow
arrow

-13%

0.38
vs 0.44

Q1.24

arrow
arrow

+11%

0.45
vs 0.41

Q2.24

arrow
arrow

+6%

0.48
vs 0.46

Q3.24

arrow
arrow

-11%

0.48
vs 0.53

Q4.24

arrow
arrow

+0%

0.38
vs 0.38

Q1.25

arrow
arrow

+7%

0.48
vs 0.45

Sales GrowthShape

status-upYoY

Current

Estimates

Q4.22

arrow
arrow

+25%

2B  vs 1.6B

Q1.23

arrow
arrow

+2%

1.7B  vs 1.7B

Q2.23

arrow
arrow

+12%

1.7B  vs 1.5B

Q3.23

arrow
arrow

+29%

2B  vs 1.5B

Q4.23

arrow
arrow

-20%

1.6B  vs 2B

Q1.24

arrow
arrow

+3%

1.7B  vs 1.7B

Q2.24

arrow
arrow

+3%

1.7B  vs 1.7B

Q3.24

arrow
arrow

-16%

1.7B  vs 2B

Q4.24

arrow
arrow

+14%

1.8B  vs 1.6B

Q1.25

arrow
arrow

-6%

1.6B  vs 1.7B

Return on EquityShape

status-upQoQ

Q2.23

arrow
arrow

+5%

0.05
vs 0.04

Q3.23

arrow
arrow

+5%

0.05
vs 0.05

Q4.23

arrow
arrow

+4%

0.04
vs 0.05

Q1.24

arrow
arrow

+4%

0.04
vs 0.04

Q2.24

arrow
arrow

+5%

0.05
vs 0.04

Q3.24

arrow
arrow

+4%

0.04
vs 0.05

Q4.24

arrow
arrow

+3%

0.03
vs 0.04

Q1.25

arrow
arrow

+4%

0.04
vs 0.03

Institutionnal OwnershipShape

status-up

Earnings Growth

Latest News