You have successfully sign out
Loading...
HMM Co.,Ltd
011200.KS
Company Description
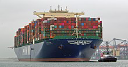
HMM Co.,Ltd, an integrated logistics company, provides shipping and logistic services worldwide. The company transports commodities, such as crude oil, coal, iron ore, and various special cargoes, as well as import/export goods. It operates container ships; bulk carriers; tankers, such as crude and product tankers; and trampers that include Cape, Panamax, and Supramax/Handy, as well as heavy lifts and special product carriers. The company was formerly known as Hyundai Merchant Marine Co.,Ltd. and changed its name to HMM Co.,Ltd in March 2020. HMM Co.,Ltd was founded in 1976 and is based in Seoul, South Korea.
KSC
25950.00KRW
Market Open
Relative Strenght
Volume Buzz
-17%Earning Acce
NoDist 52w H.
1%